Mechanically, the core of Daggerheart’s rules is the 2d12 Duality dice representing Hope and Fear. These dice are comparable to the d20 in D&D 5e: both are used to determine whether most uncertain actions result in success and failure. The d20 is relatively easy to understand, but what is the math behind a 2d12 roll?
5e has often been criticized for being “swingy,” and although that can mean many things, a common interpretation is that the d20 overemphasizes luck. Does the 2d12 in Daggerheart fare any better?
I myself had a lot of intuitions for how this worked, but I actually ran the numbers to figure out the truth here.
(Note that much of the analysis below compares 2d12 against 1d20. I think the 2d12 is plenty interesting on its own, but most data is best understood in context, and the 5e d20 test is likely familiar to many Daggerheart players)
How frequently do dice rolls come up?
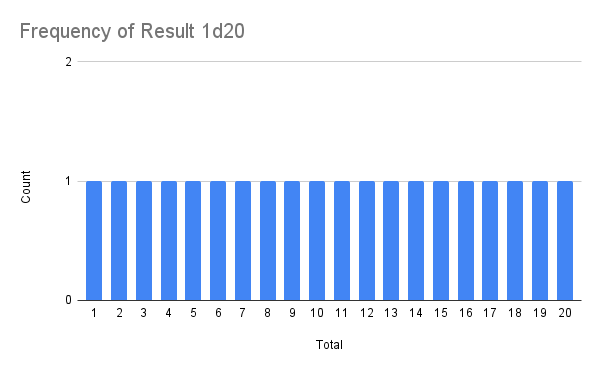
Let’s start just by counting all of the different possible results we can get when we roll.
The 1d20 is pretty straightforward: there’s exactly one way to get each result
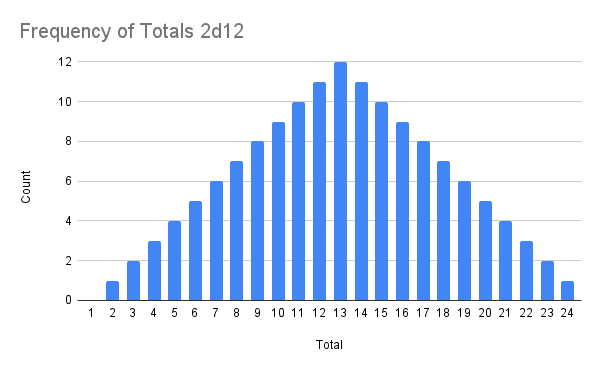
However, with 2d12, you’re more likely to get middle numbers. Although there’s only one way to roll a 2 (1-1), there are 12 ways to roll a 13 (1-12, 2-11, 3-10, 4-9, 5-8, 6-7, 7-6, 8-5, 9-4, 10-3, 11-2, 12-1)
To compare these two distributions, we can plot them together to see what the probability of any given result is
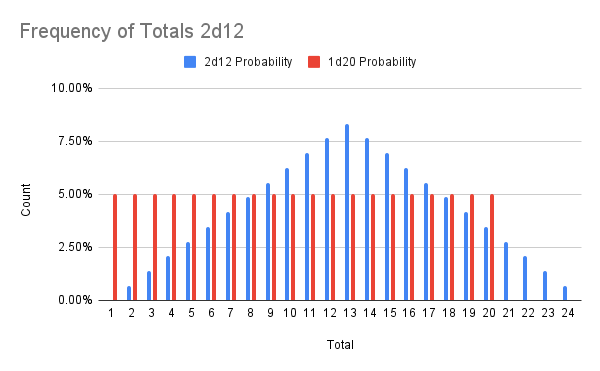
As you can see, the 2d12 ranges from about .7% at the extremes to about 8.3% at the middle, where 1d20 is always 5% across the board.
I think this is why people tend to say that 1d20 is “swingy” because you’re more likely to get extreme rolls, whereas 2d12 makes it more likely to get something in the middle.
I’ll note that in general, it is true that you’re going to get more consistent results if you roll more dice. To compare, imagine two scenarios:
- You flip one coin: if it’s heads, you get $100. If it’s tails, you get nothing
- You flip 100 coins: for each head, you get $1. For each tail, you get nothing
In both cases, you’re flipping coins for between $0 and $100. In the first scenario, it’s a 50-50 on the extremes. In the second scenario, you probably expect to get pretty close to $50.
Of course, this isn’t all of the math. Daggerheart’s Duality dice are about more than just rolling 2d12: there are a few other wrinkles in there.
How often do I get Hope?
The naive (and incorrect answer) is 50% because you get Hope when you roll higher on your Hope die than your Fear die.
50% is incorrect because you can also get a tie between your Hope and Fear dice, which fortunately is a critical success (in this case, the house doesn’t win). And crits get you hope. Since you get a critical success 1/12 (or ~8.3%), the next incorrect answer is ~58.3%.
This is wrong because technically, you still don’t roll higher 50% of the time: you only roll higher ~45.83% of the time because you have to subtract out the crits. Then you can add all of the crits back in, so the correct answer is 54.17% of the time.
Honestly, I’m not sure how to use that information other than to remember you should get Hope a little more than half the time.
How often do I beat a given difficulty?
The graph above about probabilities of different results doesn’t quite tell you how often you should expect to succeed for two reasons.
- You need to add up multiple columns in case you not only tied but also beat the result (i.e. rolling 12 beats a difficult of 10)
- You always succeed on a critical success
If we account for both of these, here’s the probability that you beat various difficulties.
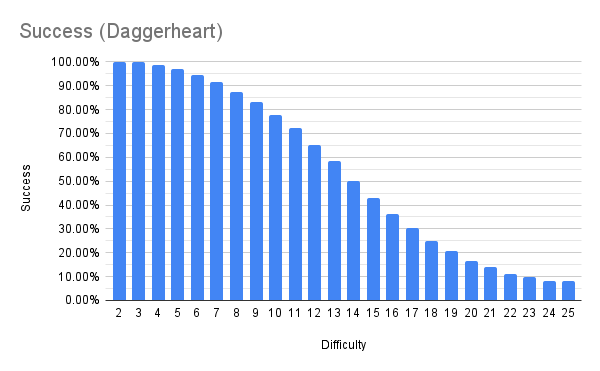
To highlight how cool this is, I’ll compare this to the probability of success with 1d20 (assuming that 20s count as critical successes)
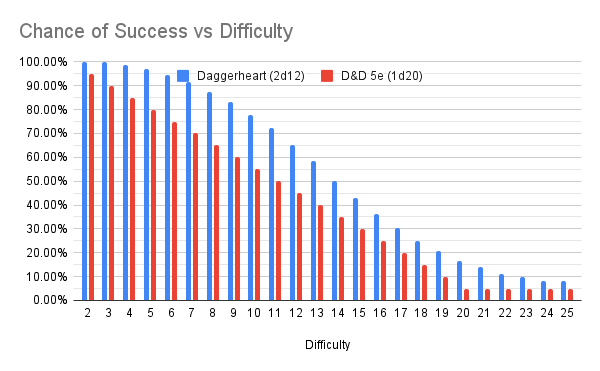
Whereas the 1d20 very consistently reduces by 5% for every step in difficulty, the 2d12 Duality dice has a little more shape to it. At low difficulties, your chance of success remains high. In fact, without any modifiers, you should expect to beat a 10 around 78% of the time.
However, in those middle difficulties, the probability of success drops much more quickly until it levels off at the very high difficulties.
(For what it’s worth, I will note that the binary test is why the d20 is not quite as swingy as you might think: if you’re trying to beat a 10, then a 9 is as bad as a 1)
The more notable fact is that for any specific difficulty, the blue bar is taller. Does this mean that players are more likely to succeed in Daggerheart than D&D?
Yes, but it’s a little more complicated.
How do modifiers affect the results?
With D&D 5e, each additional +1 will increase your probability of success by 5%. Whether that’s going from -1 to 0 or +6 to +7, It always gives you the same increase.
With Daggerheart, increasing your modifiers will also increase your probability of success. However, the amount of increase depends on what number you need to roll to succeed.
Just like you can use your roll + modifier and compare it to your difficulty, you can determine your target number as difficulty – modifier.
(As an aside, I’m actually a big fan of GMs telling players the difficulty beforehand, players doing the math, then rolling. It’s way more epic when you instantly know the result when the dice hit the table instead of fumbling to find your modifier and doing math afterwards).
Let’s look at the graph above again to see how that matters.
Let’s say that the difficulty is set at 10, and your modifier is +2. In practice, that means your probability of success is that bar for 8 (87.5%). If your modifier was +3, then your probability of success is the bar for 7 (91.67%), which is only 4.17% better. However, if the difficulty was 15, then going from +2 to +3 increases your probability of success by 6.94%.
Because the 2d12 dice totals are a pyramid, it depends on where from 2 to 24 you are as to what changes.
…So will I succeed more often in Daggerheart than D&D?
Based on the point above, the important thing is that we need to define success both in terms of the modifier and the difficulty. I could give you an entire spreadsheet to look at this for every modifier and every difficulty, but we can actually simplify this in 2 ways.
First, we can use a few different fixed modifiers to make apples-to-apples comparisons. Specifically, I chose 3 different values:
- +0. Both Daggerheart and D&D have +0 as a normal, average roll
- +4 Daggerheart vs +5 D&D. This represents the modifier that a level 1 character would expect to get in their “best” stats.
- +10 Daggerhaert vs +11 D&D. This represents the modifier that a max level character would expect to get in their “best” stats
Second, we can use the definitions in the rules for common difficulties and what they mean. Fortunately, both systems have the same scale:
- Very Easy: 5
- Easy: 10
- Average: 15
- Hard: 15
- Very Hard: 25
- Nearly Impossible: 30
Here’s how these compare:
| Very Easy | Easy | Average | Hard | Very Hard | Nearly Impossible | ||
| DH | +0 | 97% | 78% | 43% | 17% | 8% | 8% |
| D&D | +0 | 80% | 55% | 30% | 5% | 5% | 5% |
| Very Easy | Easy | Average | Hard | Very Hard | Nearly Impossible | ||
| DH | +4 | 100% | 94% | 72% | 36% | 14% | 8% |
| D&D 5e | +5 | 100% | 80% | 55% | 30% | 5% | 5% |
| Very Easy | Easy | Average | Hard | Very Hard | Nearly Impossible | ||
| DH | +10 | 100% | 100% | 97% | 78% | 43% | 17% |
| D&D 5e | +11 | 100% | 100% | 85% | 60% | 35% | 10% |
You are welcome to draw your own conclusions, but here’s what jumped out at me.
- Daggerheart has a base critical success rate of 8.33%, so the floor is a bit higher, but probably not noticeably so.
- Ignoring the extremes, the difference ranges from about 7% to about 17%
- It’s surprisingly common to fail at a “Very Easy” test in D&D.
- “Nearly Impossible” is more doable than I would have expected
Of course, the actual full range of difficulties goes even beyond numbers: a GM can always decide that a player doesn’t need to roll because the action is trivial or literally impossible.
Final Thoughts
I hope you found the data and charts interesting, even if it doesn’t directly impact the way you play. As much as I love games for the joy of playing, I also like when games give me an opportunity to think a little deeper, too.
Again, this analysis is not to say that Daggerheart or D&D are better or worse systems as far as dice mechanics. I only compare them since I suspect that 5e is quantitatively easier to grasp, and many players have real-life experience with how those probabilities feel.
In the future, I hope to cover a few other dice-related topics, such as:
- What is the impact of Advantage and Disadvantage?
- How about Rally, Prayer, or other dice manipulation?
I’m certainly open to suggestions on what else to write about as well!
If you want to check my math or do your own analysis, here’s what I did in Google Sheets to get the numbers and graphs.
Elsewhere in Daggerheart
BladeBound Saga has another video up. This time, we get a look at the new encounter building rules to expect in the release version
Leave a Reply